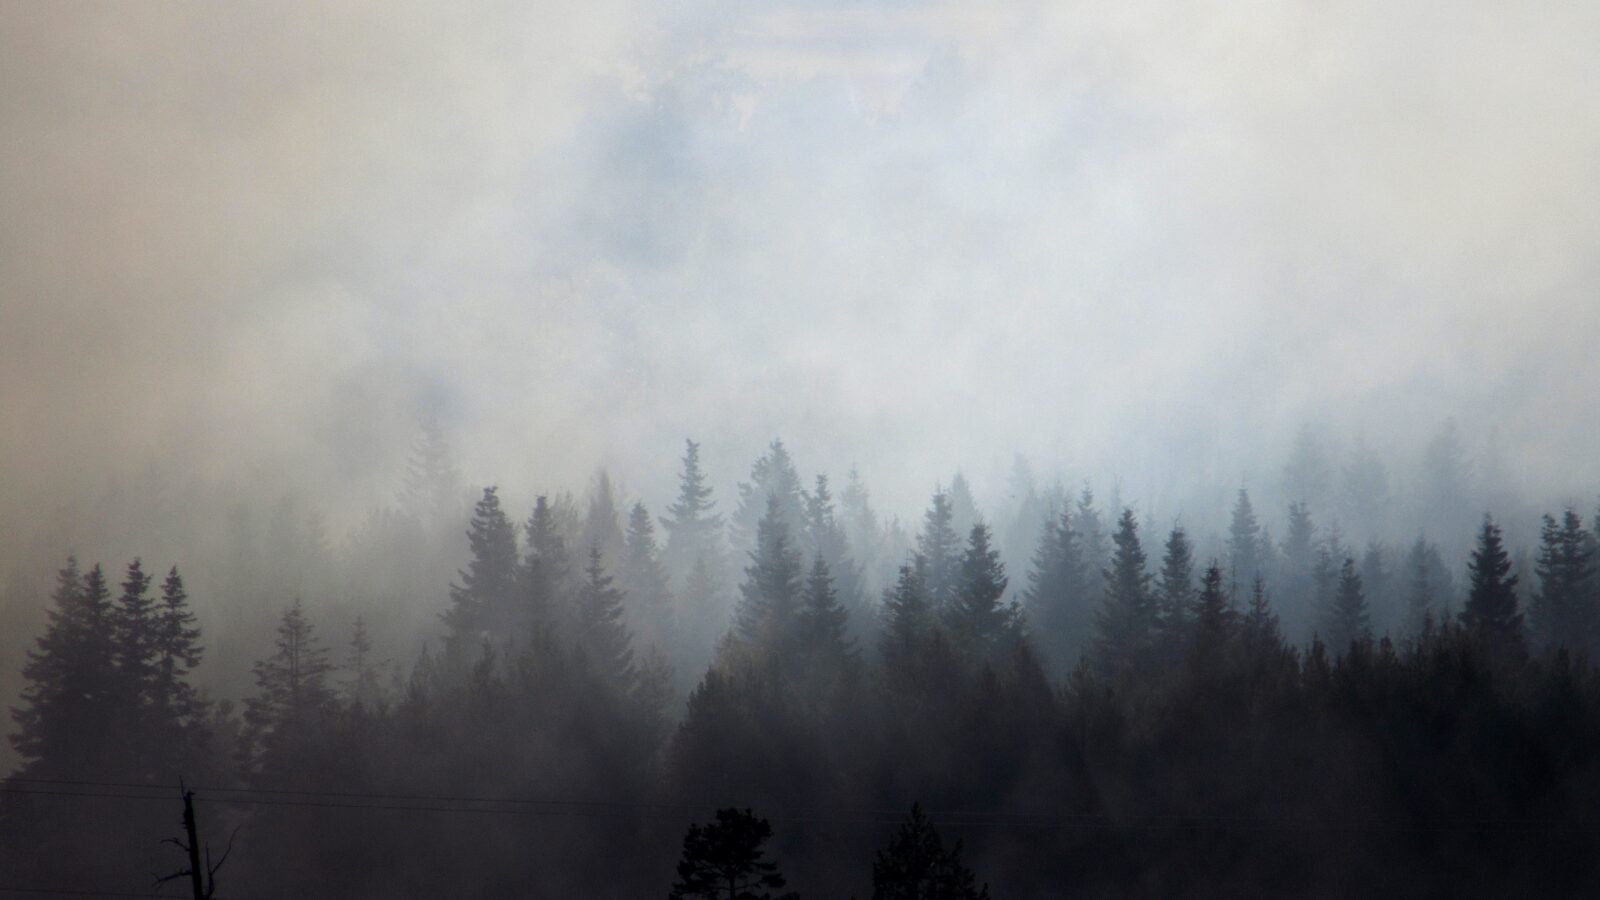
What the 2026 Wildfire Season Is Telling Us
At RedZone, we work with insurers every day who are trying to make sense of wildfire risk. The 2026 season offers a useful lens for understanding why that work matters, and why the right data changes what you see.
The 2026 wildfire season is providing another reminder that wildfire risk cannot be measured by a single fire, state, or even region.
By mid-September, more than 8.5 million acres had burned across the United States, according to the National Interagency Fire Center (NIFC). As of September 18, 56,289 fires had burned 8,523,213 acres. That represents 126% of the 10-year average number of fires and 146% of the average acreage burned by this point in the year.
The Weather Channel recently described 2026 as being on pace to become the largest U.S. wildfire season by area burned in more than a decade. With weeks of potential fire activity still remaining across parts of the country, the final numbers have yet to be written.
But acreage alone does not tell the full story.
The more important signal may be what happened while those acres were burning: numerous large incidents occurring simultaneously, firefighting resources moving across regions, extraordinary activity in the Pacific Northwest, and dramatically different conditions elsewhere.
For organizations responsible for protecting people, property, and assets from wildfire, that variability is one of the most important stories of 2026.
A Season That Put National Resources Under Pressure
One of the clearest indicators of the intensity of the 2026 season came from the National Preparedness Level.
From July 18 through September 4, the United States spent 49 consecutive days at Preparedness Level 5 (PL5), the highest level in the national wildland fire preparedness system. During this period, national firefighting resources were heavily committed and federal officials warned of high competition for available resources.
Engines, aircraft, crews, incident management teams, and other specialized resources are shared through a national response system. A wildfire is rarely occurring in isolation from everything else burning at the same time.
When large incidents develop simultaneously across multiple regions, priorities must be established nationally and resources may have to travel farther to reinforce new incidents.
TIME reported that by August 31, the U.S. Forest Service and U.S. Wildland Fire Service had already used more than 70% of their combined $6 billion in fire-suppression budget authority for fiscal year 2026.
For communities and organizations exposed to wildfire, this is an important operational reality. Relying entirely on suppression after a fire starts becomes an increasingly difficult strategy when multiple major incidents are competing for limited resources. Understanding exposure before an incident occurs, and reducing vulnerability where possible, matters more in seasons like 2026 than in quieter ones.
Oregon Shows the Scale of the 2026 Season
Few states illustrate this year’s conditions better than Oregon.
By mid-September, roughly 4,000 square miles, or approximately 2.56 million acres, had burned in Oregon, according to The Weather Channel, marking the largest acreage burned in the state’s recorded history.
The financial impact has been significant as well. TIME reported that Oregon had spent approximately $236 million on wildfire response by late August, with officials projecting total state costs could reach $350 million.
Washington faced similar pressure. The Weather Channel reported that the state spent more than $200 million fighting wildfires during a single month.
These numbers demonstrate how quickly wildfire becomes more than a fire-management problem. Large seasons affect emergency services, public agencies, utilities, insurers, businesses, homeowners, and entire communities simultaneously.
But 2026 Hasn’t Been Extreme Everywhere
One of the most interesting aspects of the 2026 season is how uneven it has been.
While the national acreage total is running far above average and the Pacific Northwest has experienced exceptional fire activity, California has had a remarkably quiet year by comparison.
That difference was already apparent by the end of July. KMPH reported that a little over 200,000 acres had burned statewide at that point, about 68% of the normal acreage for that time of year, even as massive fires were burning just to the north in Oregon.
And the pattern has continued.
According to CAL FIRE, as of September 14, 322,153 acres had burned in California in 2026. During the same interval in 2025, 520,180 acres had burned. The five-year average for the same point in the season is 848,411 acres.
That puts California at only about 38% of its recent five-year average acreage burned, even while the United States as a whole is running 46% above the national 10-year average.
California has also recorded fewer fires. CAL FIRE reported 5,420 wildland fires through September 14, compared with a five-year average of 7,044 during the same period.
Alaska provides another dramatic example. The Weather Channel reported that Alaska is experiencing one of its quietest wildfire seasons in more than 30 years, following an abnormally cold spring and a lack of sustained hot weather.
The contrast between Oregon, California, and Alaska highlights something fundamental about wildfire:
There is no single wildfire season experienced equally everywhere.
Conditions constantly change based on fuels, drought, weather, topography, ignition patterns, and human activity. An extraordinarily active year nationally can still include regions experiencing below-average activity.
And within an active region, risk can vary significantly from one community, or even one property, to the next. This is the reason property-level scoring exists, and why portfolio-level concentration analysis tells a materially different story than state-level acreage data.
Acreage Isn’t the Same as Risk
National acreage totals are useful for understanding the scale of a fire season, but they should not be confused with measures of property risk.
A 100,000-acre wildfire burning primarily across remote land may have significantly less impact on homes and infrastructure than a 5,000-acre wind-driven fire moving through the wildland-urban interface.
The January 2025 Los Angeles fires illustrate this difference clearly. The Palisades and Eaton fires burned approximately 37,500 acres, a tiny fraction of the acreage burned nationally during a typical year. Yet they destroyed nearly 17,000 structures and resulted in an estimated $53 billion in total damage, including approximately $40 billion in insured losses. RedZone’s scoring model had flagged properties in those fire paths as high risk before the fires occurred. That kind of advance identification, validated against real loss outcomes, is what separates a useful wildfire intelligence tool from a broad hazard map.
That is why acreage alone is an incomplete measure of wildfire consequence.
What matters is not simply how much land burns. It is what is in the path of the fire, how vulnerable those assets are, and how effectively that risk has been managed before the fire arrives.
Below Trend First-Half Natural Catastrophe Insured Losses
This geographic discrepancy between hazard activity and financial consequence was also evident across broader U.S. catastrophe events in the first half of 2026. According to preliminary estimates from the Swiss Re Institute, global insured natural catastrophe losses reached USD 42 billion in the first half of the year. This total was the lowest first-half outcome since 2020 and fell well below the trend estimate of USD 66 billion.
Despite the below-trend totals, insurance covered approximately 42% of the USD 100 billion in global economic losses from natural catastrophes. This coverage rate was notably higher than the 30-year average of 33%. The elevated coverage rate was largely because much of the damage occurred in the United States and other markets with high insurance penetration.
In the U.S., severe convective storms (SCS) were the primary driver, generating USD 28 billion in insured losses. While this was the lowest total since 2021, it still ended four consecutive years of first-half losses exceeding USD 30 billion. The lower loss totals reflect the fact that major storm outbreaks largely spared the most densely populated, highly insured regions in Texas, the Southern Plains, and the Southeast. Much like the contrast between remote wildfire acreage and wildland-urban interface fires, the financial consequences of all natural catastrophes depend heavily on the intersection of severe events and concentrated asset exposure.
Wildfire Risk Is Increasingly Financial Risk
The cost of wildfire also extends far beyond suppression.
A Department of the Interior review cited by TIME estimated that wildfires impose between $87 billion and $424 billion in annual costs in the United States when property damage, health impacts, and broader economic losses are considered. Another analysis cited by TIME estimated that suppression represented only about 9% of the full community cost of wildfire in the case studies it examined.
The remaining costs appear in many forms: destroyed homes, damaged infrastructure, business interruption, health impacts, lost income, rebuilding costs, and increasingly, insurance availability and affordability.
TIME reported that average California homeowners insurance premiums increased 84% between the end of 2020 and March 2026, citing Stanford researchers who attributed the increase to a combination of wildfire risk, inflation, and California’s regulatory environment.
The scale of potential property exposure is substantial. According to Cotality data cited by TIME, more than 2.5 million properties across 10 highly exposed states face moderate or greater wildfire risk, representing nearly $1.4 trillion in reconstruction value. California alone accounts for approximately 1.28 million of those properties.
California’s current insurance market also demonstrates that the financial effects of wildfire risk can spread beyond the properties that appear most exposed.
Recent reporting highlighted homebuyers in newer Inland Empire communities struggling to obtain conventional homeowners coverage, including areas considered relatively low risk. Some buyers have been pushed toward the California FAIR Plan or surplus-lines policies with significantly higher deductibles. In one example highlighted by the New York Post and Los Angeles Times, a buyer in Menifee accepted a policy carrying a $25,000 fire deductible after conventional insurers would not provide the comprehensive coverage required for the home purchase.
The FAIR Plan, designed as California’s insurer of last resort, has consequently become a much larger component of the market. As of June 2026 it covered roughly 696,000 properties, illustrating how wildfire risk can eventually affect mortgage transactions, insurance markets, property values, and household finances far beyond the perimeter of an active fire.
There are signs of improvement. The California Department of Insurance reported that growth in the FAIR Plan slowed substantially during early 2026 and that several major carriers have committed to expanding coverage in the state. Notably, Travelers also announced increased discounts for homeowners investing in measures including ember-resistant vents, Class A roofing, and defensible space.
That last point is particularly important.
The conversation around wildfire risk is gradually moving from simply identifying where wildfire could occur toward understanding what can actually be changed at the property and community level to reduce potential loss.
From Wildfire Response to Wildfire Risk Management
The scale and geographic variability of the 2026 season reinforces the importance of treating wildfire as a continuous risk-management problem rather than an event that begins when flames approach a community.
That means connecting several activities that have historically been treated separately:
- Identify where wildfire exposure exists before an incident.
- Assess the vulnerabilities that could turn exposure into loss.
- Reduce those vulnerabilities through mitigation and preparedness.
- Monitor changing wildfire conditions and emerging incidents.
- Respond when a fire creates a credible threat to people or property.
Each of these steps is where RedZone operates. RZRisk and RZExposure deliver property-level and portfolio-level scoring validated against real fire outcomes. RZProtect provides pre-fire inspections and on-the-ground response when fire threatens. RZAlert monitors active events in real time, showing which policies are exposed and by how much. RZIntel’s 24/7 analyst team translates that data into situational awareness briefs, dispatch recommendations, and after-action accountability. Together they form a connected system for managing wildfire risk across the full lifecycle of a fire event.
Firefighters will always be critical to protecting communities and property.
But suppression is only one part of the wildfire-loss equation.
The economic research cited by TIME is a useful reminder that the cost of putting out a fire represents only a portion of the overall consequences that follow. Property loss, insurance impacts, displacement, lost income, health effects, and recovery can continue for years after containment.
That makes the work completed before ignition increasingly important.
A hardened roof, ember-resistant vents, maintained defensible space, reduced vegetation near a structure, and other property-level measures cannot eliminate wildfire risk. They can, however, change the conditions firefighters encounter when a fire reaches a community.
The same is true operationally.
Knowing which properties are exposed, which have been mitigated, where fire behavior is changing, where evacuations are occurring, and which assets warrant intervention can help organizations focus limited resources where they can have the greatest effect.
This becomes even more important during seasons like 2026, when national firefighting resources may already be heavily committed elsewhere.
The objective is not simply to react faster.
It is to understand risk earlier, reduce preventable vulnerability, recognize meaningful threats sooner, and make better decisions when response resources matter most.
The Lesson From 2026
The final statistics for the 2026 wildfire season are still being written.
As of September 18, the United States had already recorded 8.52 million acres burned, compared with a 10-year average of approximately 5.82 million acres for the same point in the year.
But perhaps the more useful lesson is found beneath the national total.
Oregon has experienced record-setting acreage. California remains dramatically below its recent average. Alaska has experienced one of its quietest seasons in decades. Yet all three are part of the same national wildfire season.
At the same time, California demonstrates another important reality. A relatively quiet fire season does not make the underlying wildfire problem disappear. Property exposure, insurance availability, mitigation needs, and the financial consequences of future fires remain.
That variability is precisely why wildfire risk cannot be understood through national acreage totals alone.
Wildfire risk is dynamic, regional, local, and increasingly financial.
Managing it effectively requires understanding not just how much is burning, but where fire is occurring, what is exposed, how vulnerable those assets are, what has already been done to reduce that vulnerability, and what can still be done before and during an incident to reduce loss.
For organizations responsible for large numbers of properties or distributed assets, that means shifting the objective from simply reacting to wildfire to continuously understanding and managing wildfire risk. The insurers and MGAs doing this well are writing business that others cannot, retaining policyholders others lose, and building reinsurance relationships grounded in credible, defensible data. That is what a fundamentally better understanding of wildfire risk makes possible.
Sources Primary reporting: The Weather Channel, The 2026 Fire Season Is on Pace to Be Biggest in a Decade, September 16, 2026. Additional reporting and data: National Interagency Fire Center, CAL FIRE, TIME, KMPH, New York Post, Los Angeles Times, California Department of Insurance, Swiss Re Institute