This manual was designed to provide hands on instruction to the user. Proceeding through the manual, users will learn how to navigate the dashboard, utilize the tools provided, and ultimately determine the exposure of your portfolio. (place holder text)
While the RZAlert Dashboard is primarily designed to enable the user to visualize their portfolio exposure in relation to natural disasters. The dashboard has also added functionality to support communication with, colleagues, the boardroom, and even the policyholders themselves. This manual will demonstrate how to leverage this functionality.
Users are encouraged to take advantage of the videos that are embedded throughout the manual.
Navigating the Dashboard
Policy Search Tool
Clicking the Search tool prompts a search box, where the user is able to input an address in order to search anywhere on the map.
The measure tool, identified with a blue icon and a white ruler, allows for both point-to-point measuring as well as multiple-point measurements. Measurements can be completed using miles, meters, and feet.
The Policy Selection, tool can be used to generate a custom polygon. There is no limitation the size or shape of the polygon. Once complete, you can export the list of policies to an XLSX for further analysis.
Clicking your profile name will open a dropdown with options for logging out, viewing your profile, accessing the help page, and contacting support.
Layers
Open Portfolio Overview
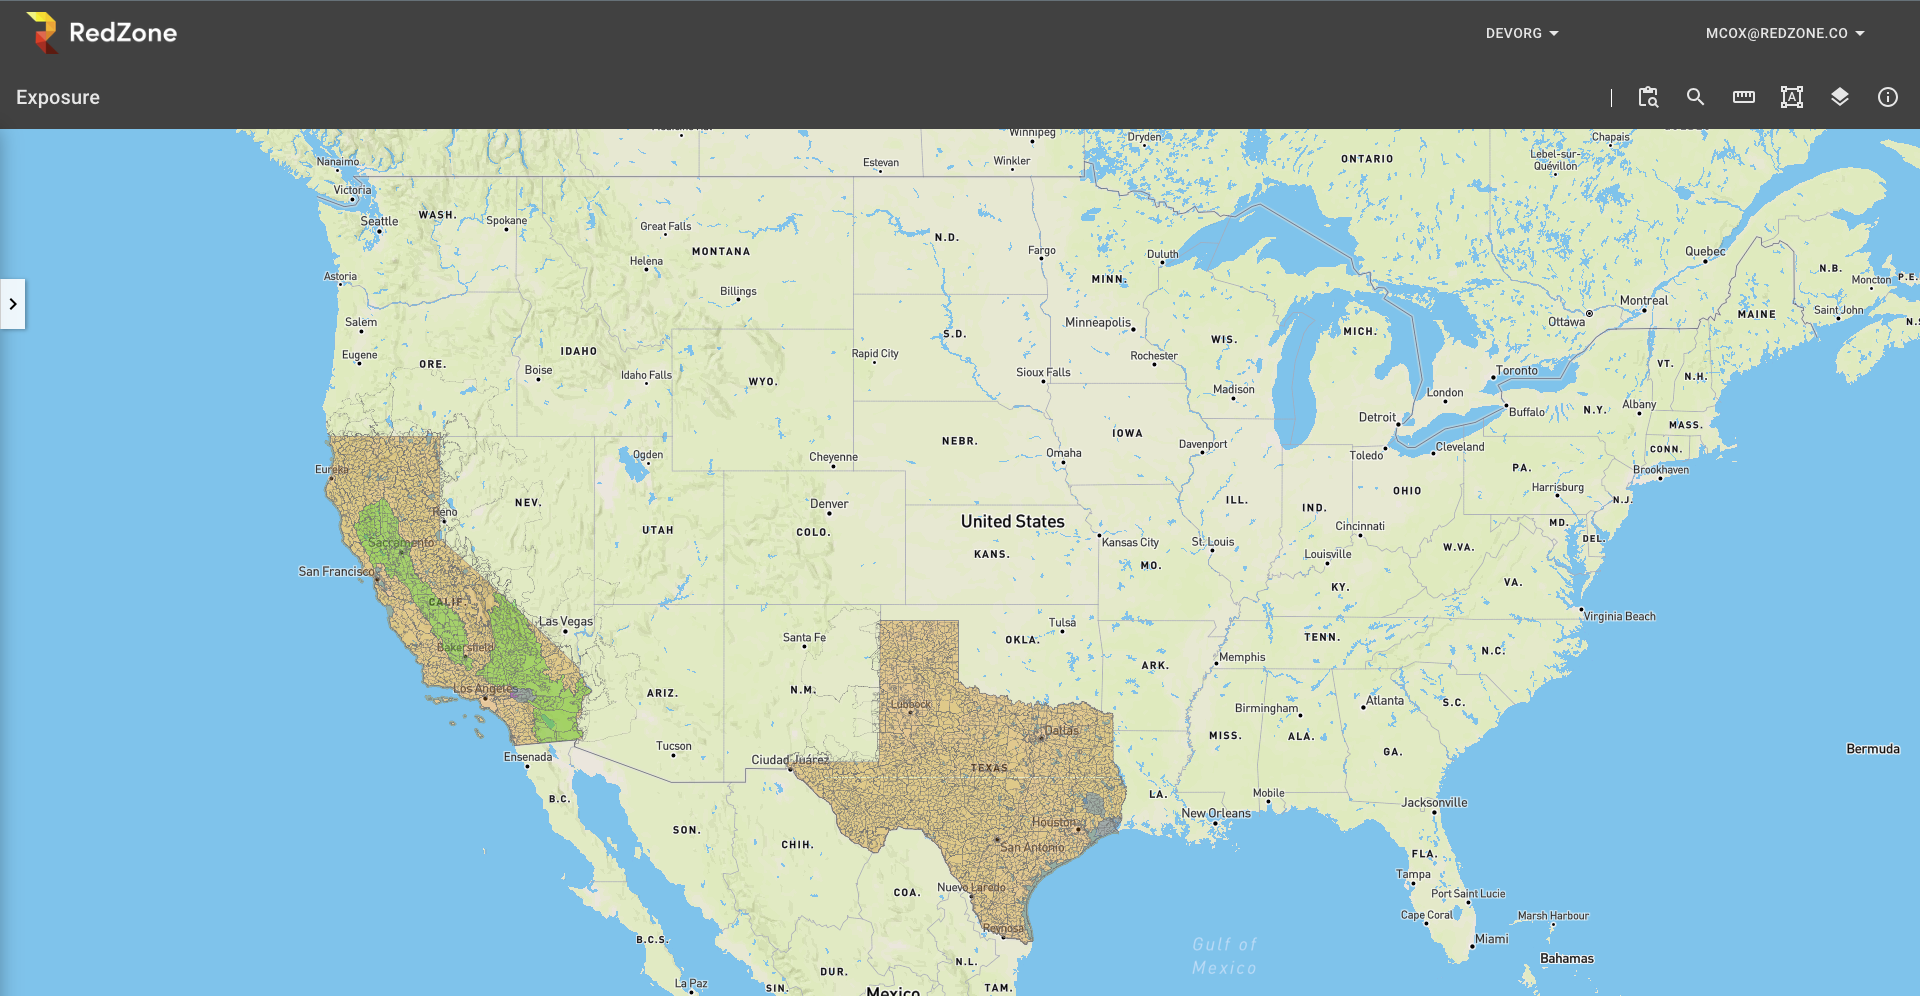
Map of Exposure
Within the RZExposure Dashboard the map in the center allows the user to pan around, zoom in and out to analyze … The top-right corner of the browser is where the map tools and map layers exist.
Dashboard Tools
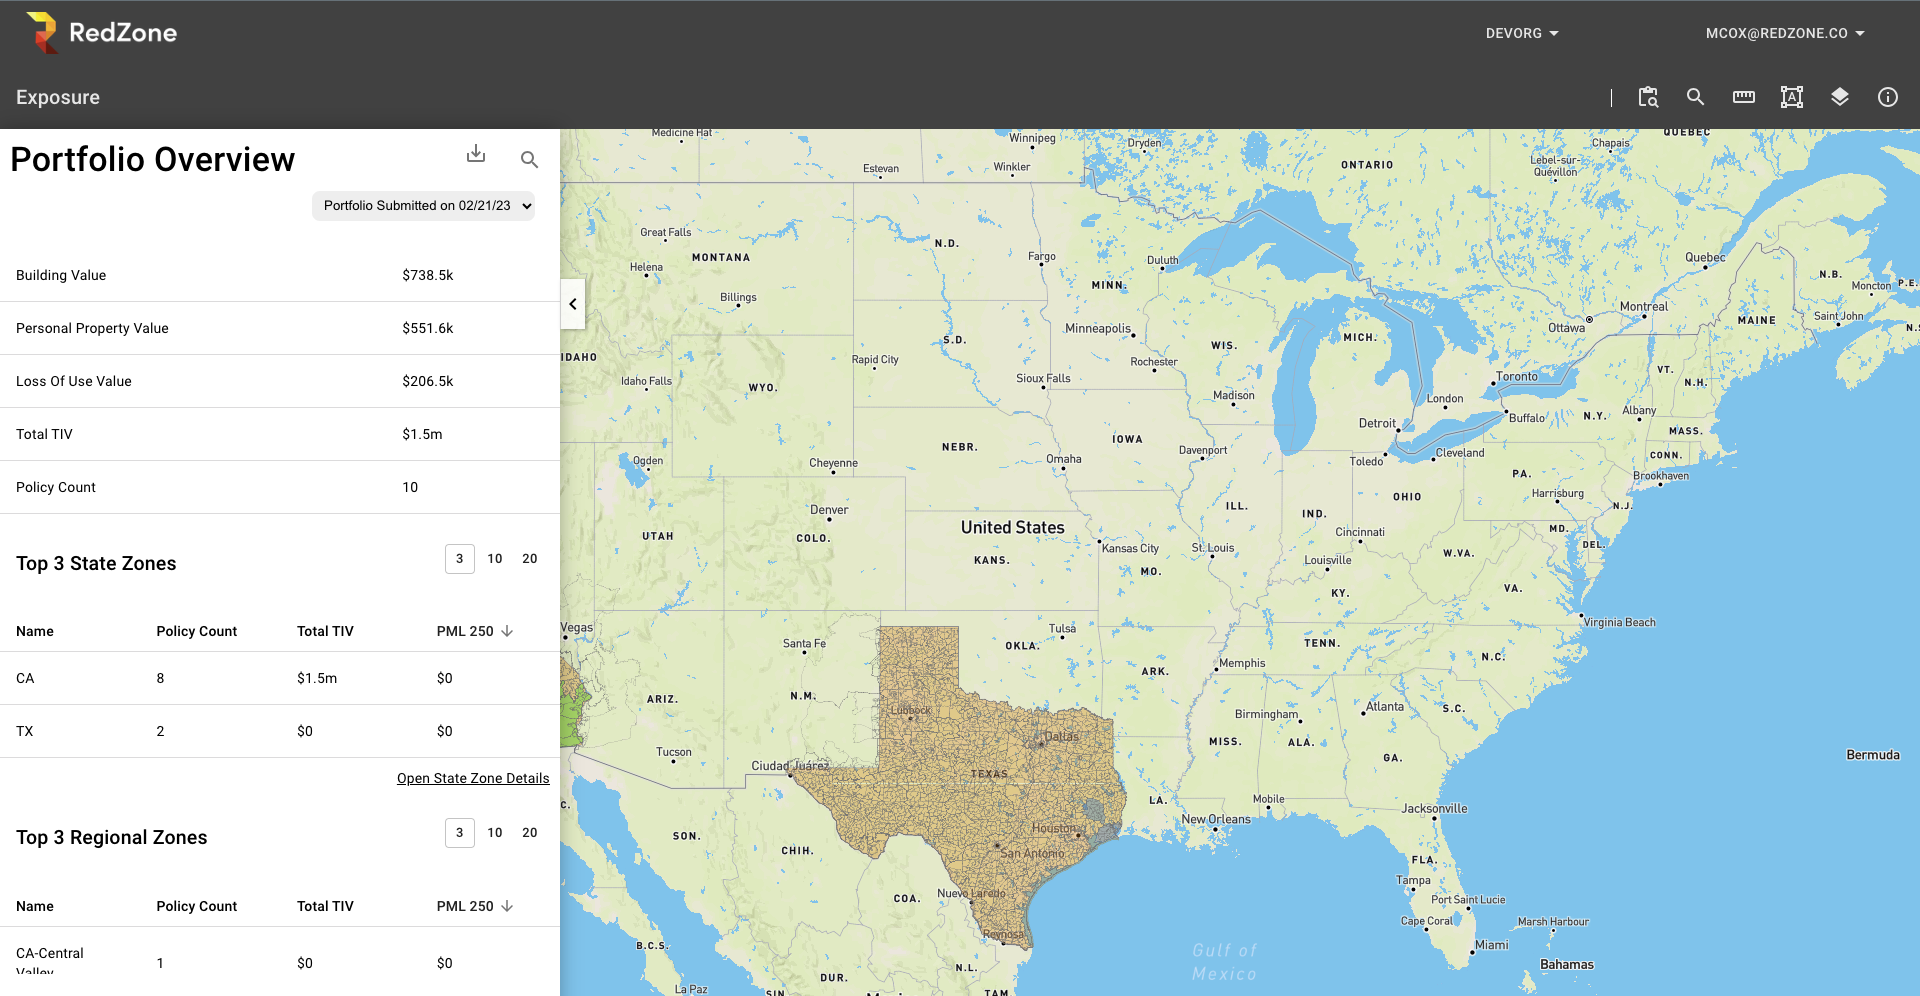
Download PML and Location Data
Search
Select and Compare Portfolios
Increase the number of displayed zones
Switch ascending/ descending order of PML
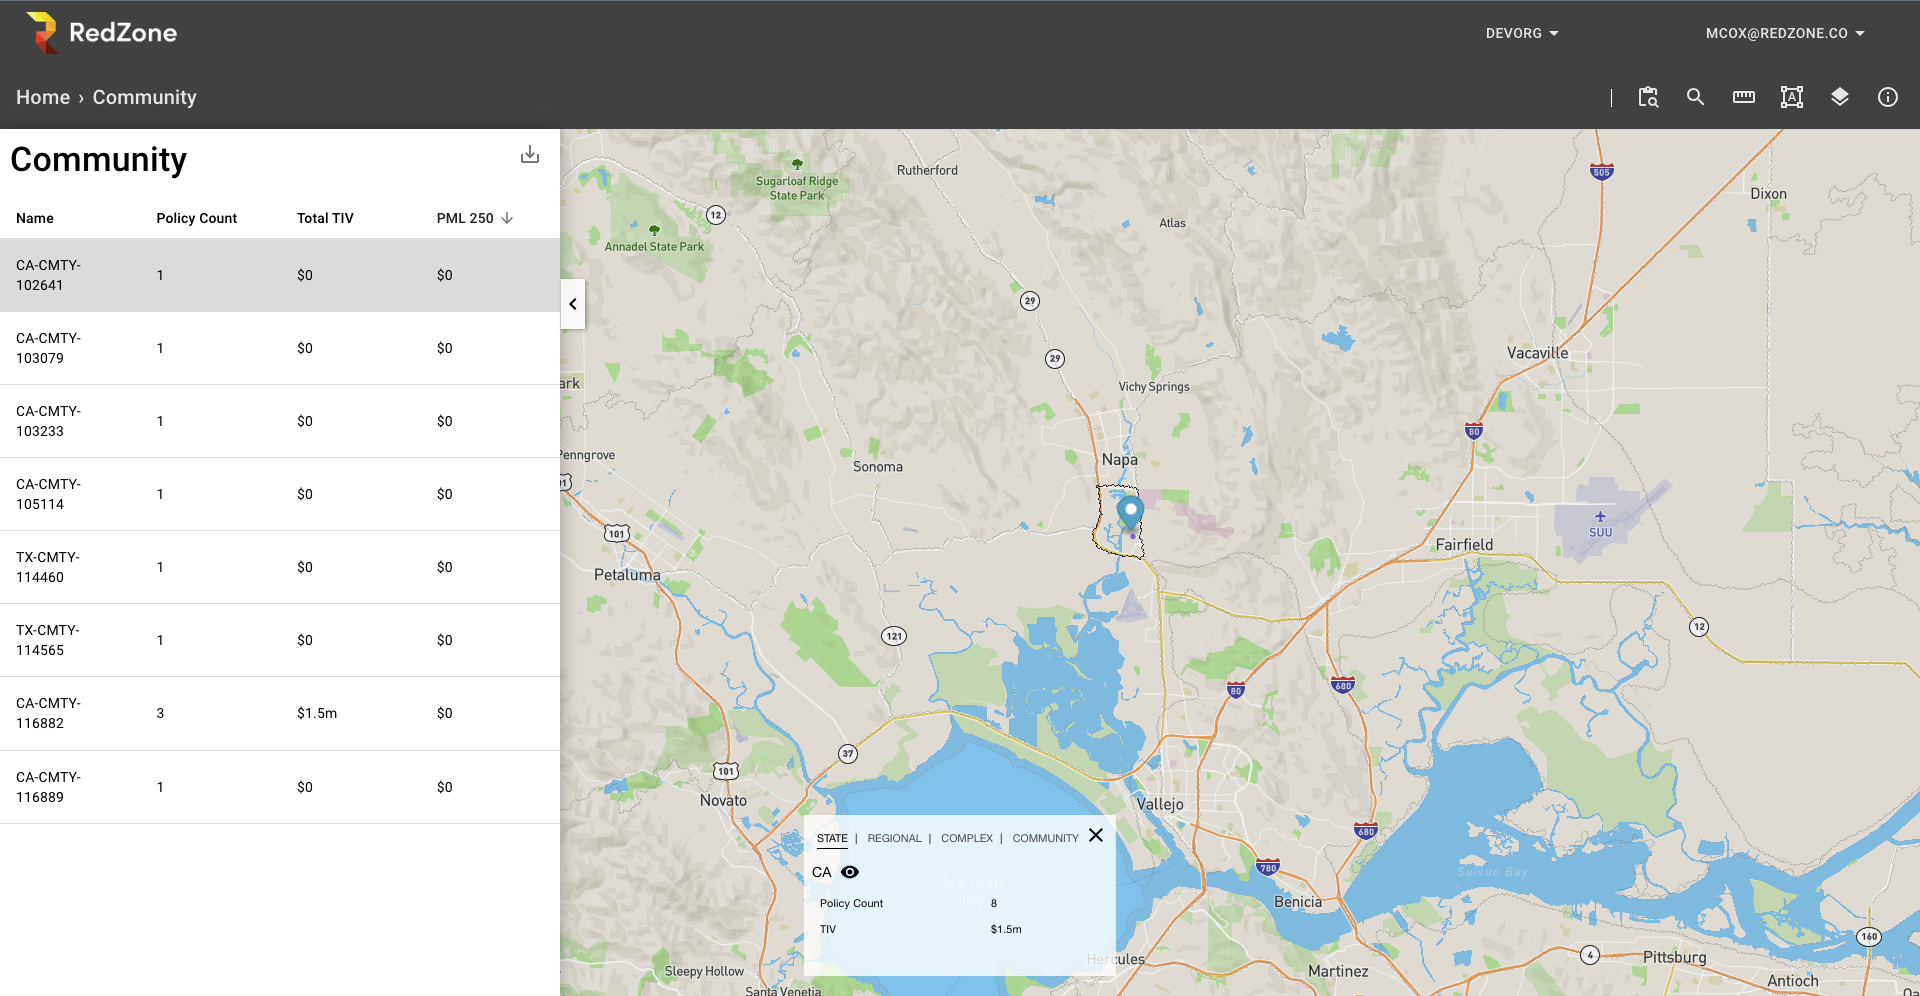
Open Zone Details
Within the RZExposure Dashboard the map in the center allows the user to pan around, zoom in and out to analyze … The top-right corner of the browser is where the map tools and map layers exist.
Portfolio Overview Tools
Within Incident details, we have a pane showing both the fire’s summary statistics and the summary feed. The addition of the summary feed will add a timeline of updates such as analyst commentary, containment information, evacuation notices which will vary and be event specific. Additional tools also become available while the Incident Details view is open.
The Policy List tool identifies the list of policyholders within the Exposure Buffer polygon. By default, the list is ordered by closest to farthest from the fire; however, the lists can be sorted by any of the columns displayed. Once in the toolbox, hovering over a name on the list will highlight the home icon on the map. By clicking on an individual client name, you will have access to details on that client’s policy. You will also have the ability to send that client a templated message updating him or her on the ongoing wildfire situation.
This tool allows you to share the link to the incident.
Clicking here will allow you to export fire data in the form of a shapefile.
This tool will generate and email a summary report of the fire.