This manual was designed to provide hands on instruction to the user. Proceeding through the manual, users will learn how to navigate the dashboard, utilize the tools provided, and ultimately determine when a natural disaster is threatening a policyholder.
While the RZAlert Dashboard is primarily designed to enable the user to visualize their policies in relation to natural disasters. The dashboard has also added functionality to support communication with, colleagues, the boardroom, and even the policyholders themselves. This manual will demonstrate how to leverage this functionality.
Users are encouraged to take advantage of the videos that are embedded throughout the manual.
Navigating the Dashboard
In order to switch modes, simply click the button associated with the natural disaster of interest. You will notice that the background map and the tile pane on the left-hand portion of the screen change to show that natural disaster mode.
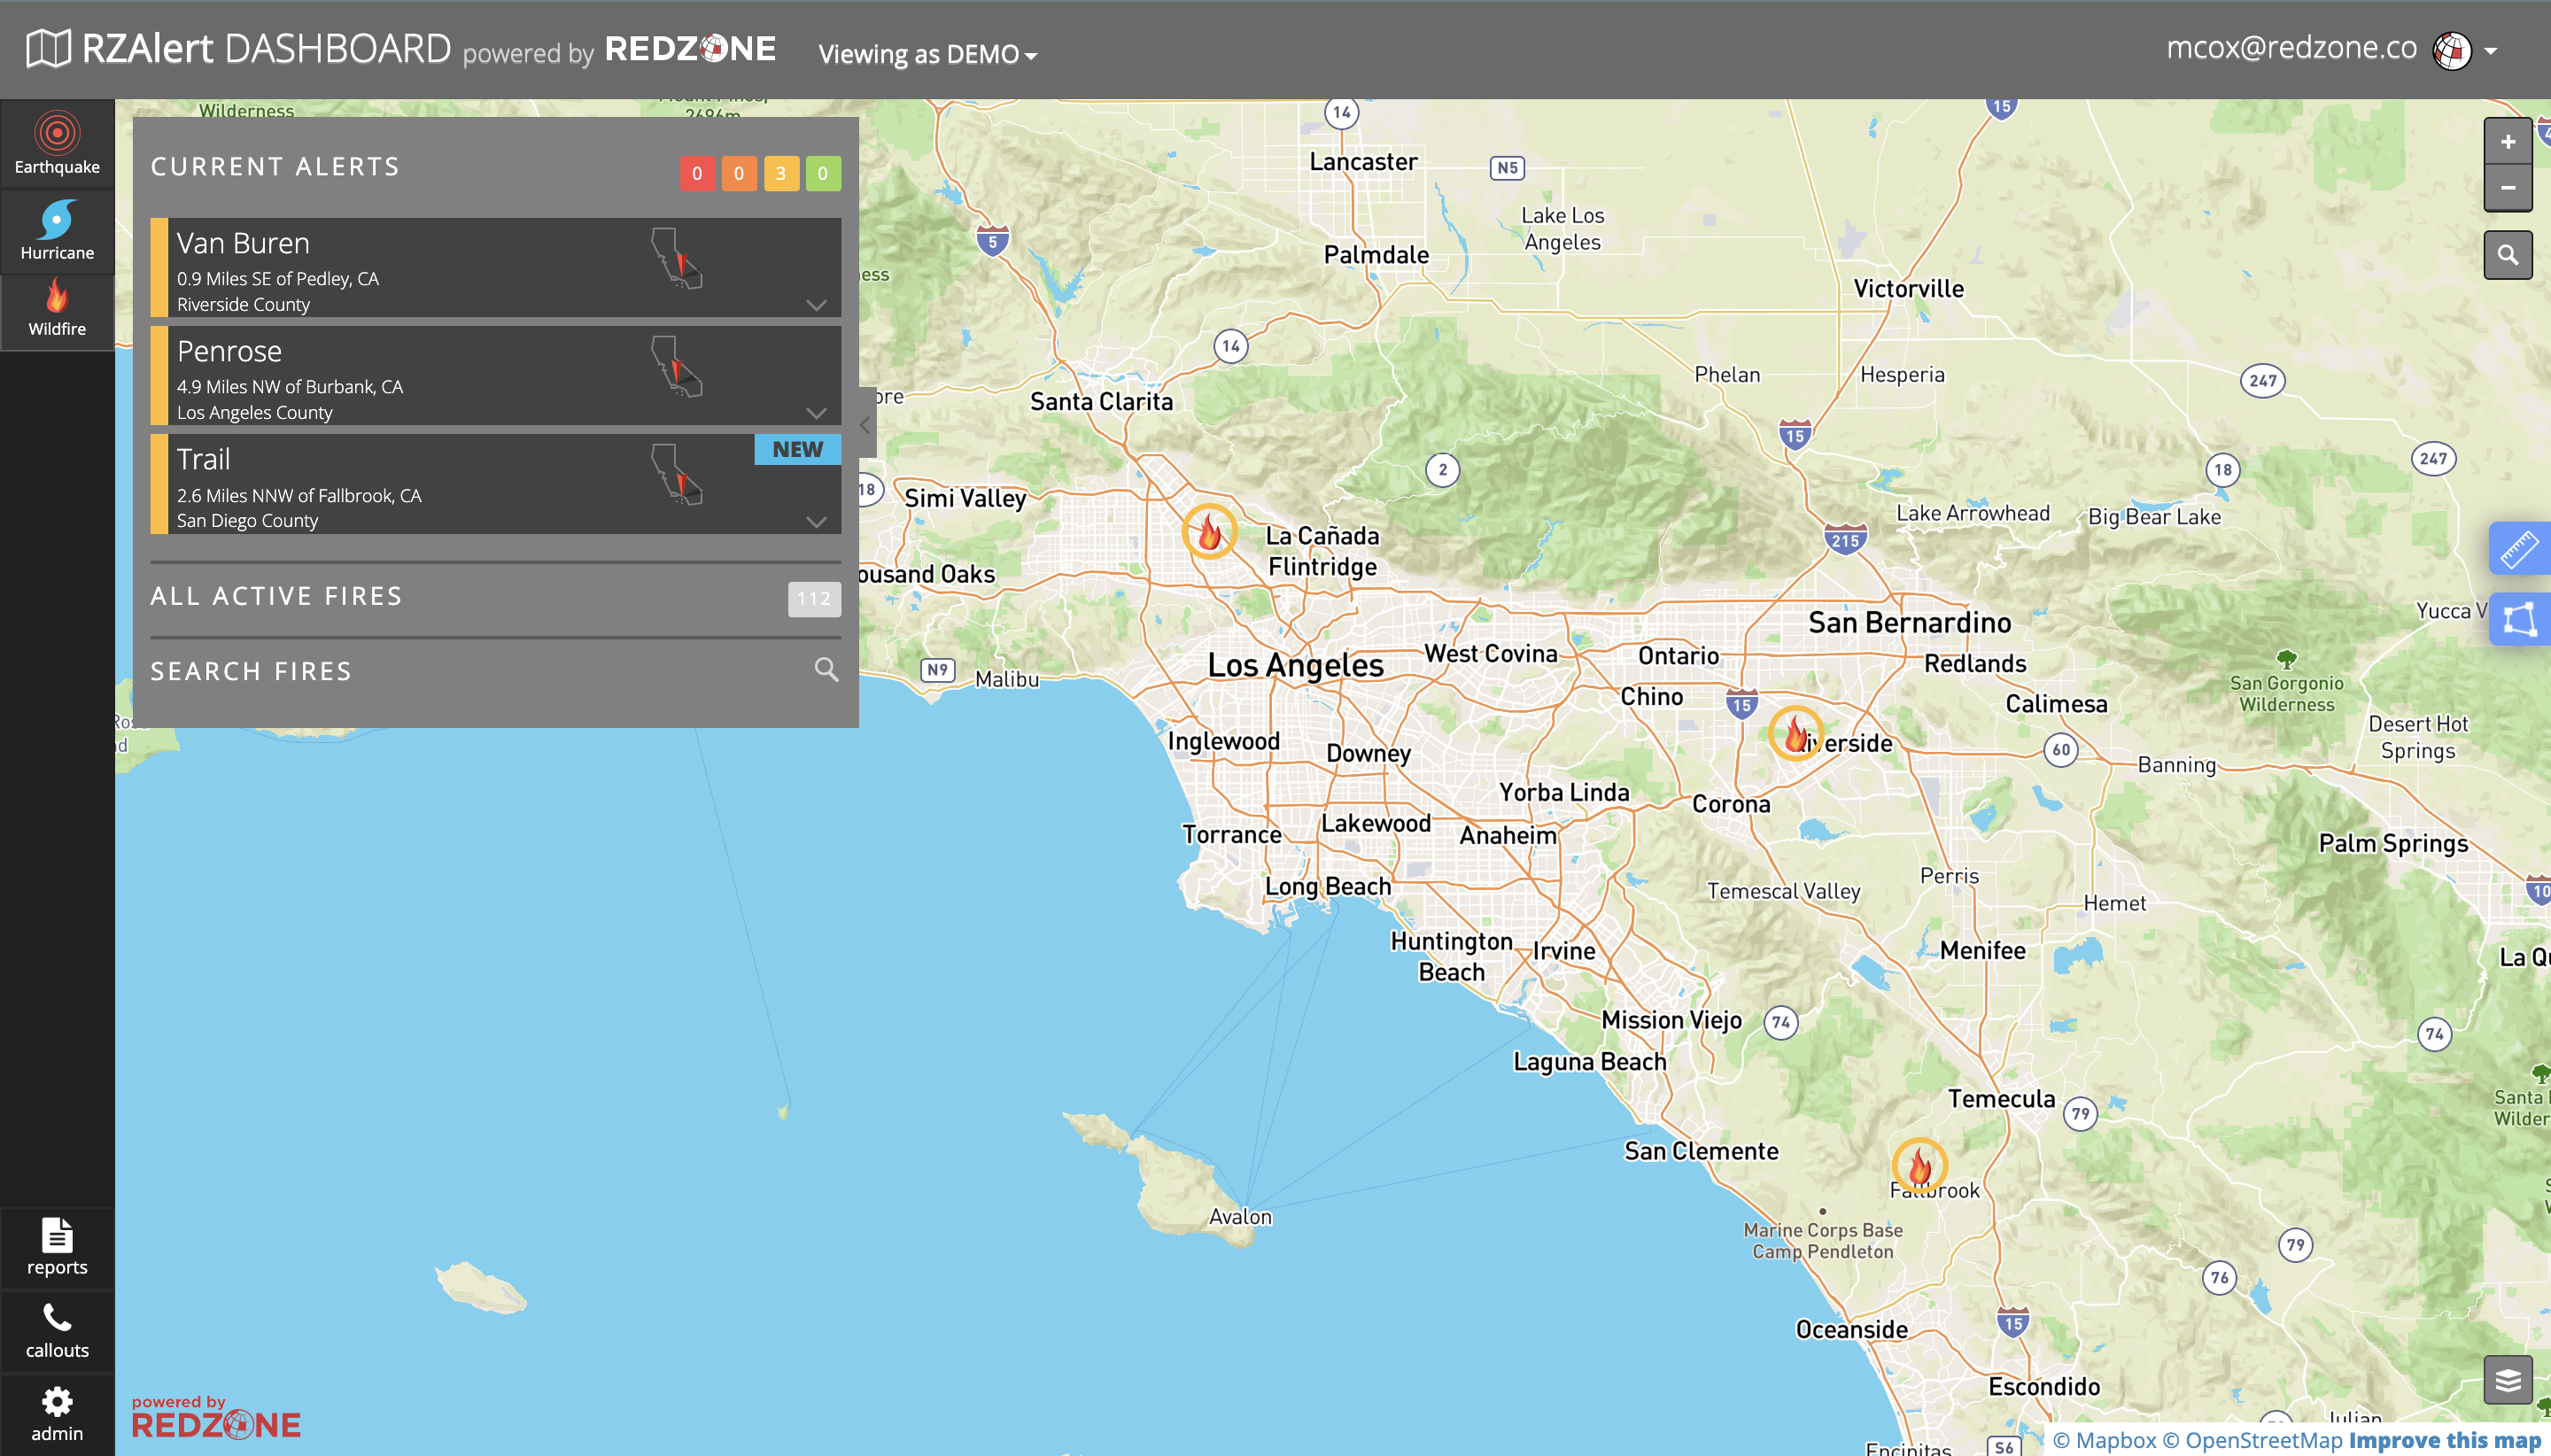
Current Alerts pane indicates those fires that meet the “Alert” threshold near your policyholders based on a proprietary wildfire score generated by RedZone.
The measure tool, identified with a blue icon and a white ruler, allows for both point-to-point measuring as well as multiple-point measurements. Measurements can be completed using miles, meters, and feet.
The Policy Selection, tool can be used to generate a custom polygon when zoomed into a particular incident. There is no limitation the size or shape of the polygon. Once complete, you can export the list of policies to an XLSX for further analysis.
Clicking your profile name will open a dropdown with options for logging out, viewing your profile, accessing the help page, and contacting support.
Clicking the Search tool prompts a search box, where the user is able to input an address in order to search anywhere on the map.
Clicking the Fire Search tool prompts a search box, where the user is able to input a fire name in order to search active and historic fires.
Map layers, found in the bottom right-hand corner indicated with button, include both default layers available to every customer as well as additional layers specific to customer needs. The default layers include different base maps: Standard, Satellite, Hybrid, and Light. Zip codes, Modis Hot Spots, and policy information are additional layers available to the user. Specific layers are activated by zoom levels or when selected on an incident, as mentioned previously in the Incident Details section.
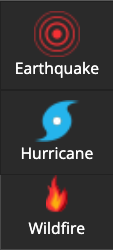
The RZAlert Dashboard has three modes within it: Wildfire, Hurricane, and Earthquake modes. Upon first logging in, the user will be in Wildfire Mode by default.
In order to switch modes, simply click the button associated with the natural disaster of interest. You will notice that the background map and the tile pane on the left-hand portion of the screen change to show that natural disaster mode
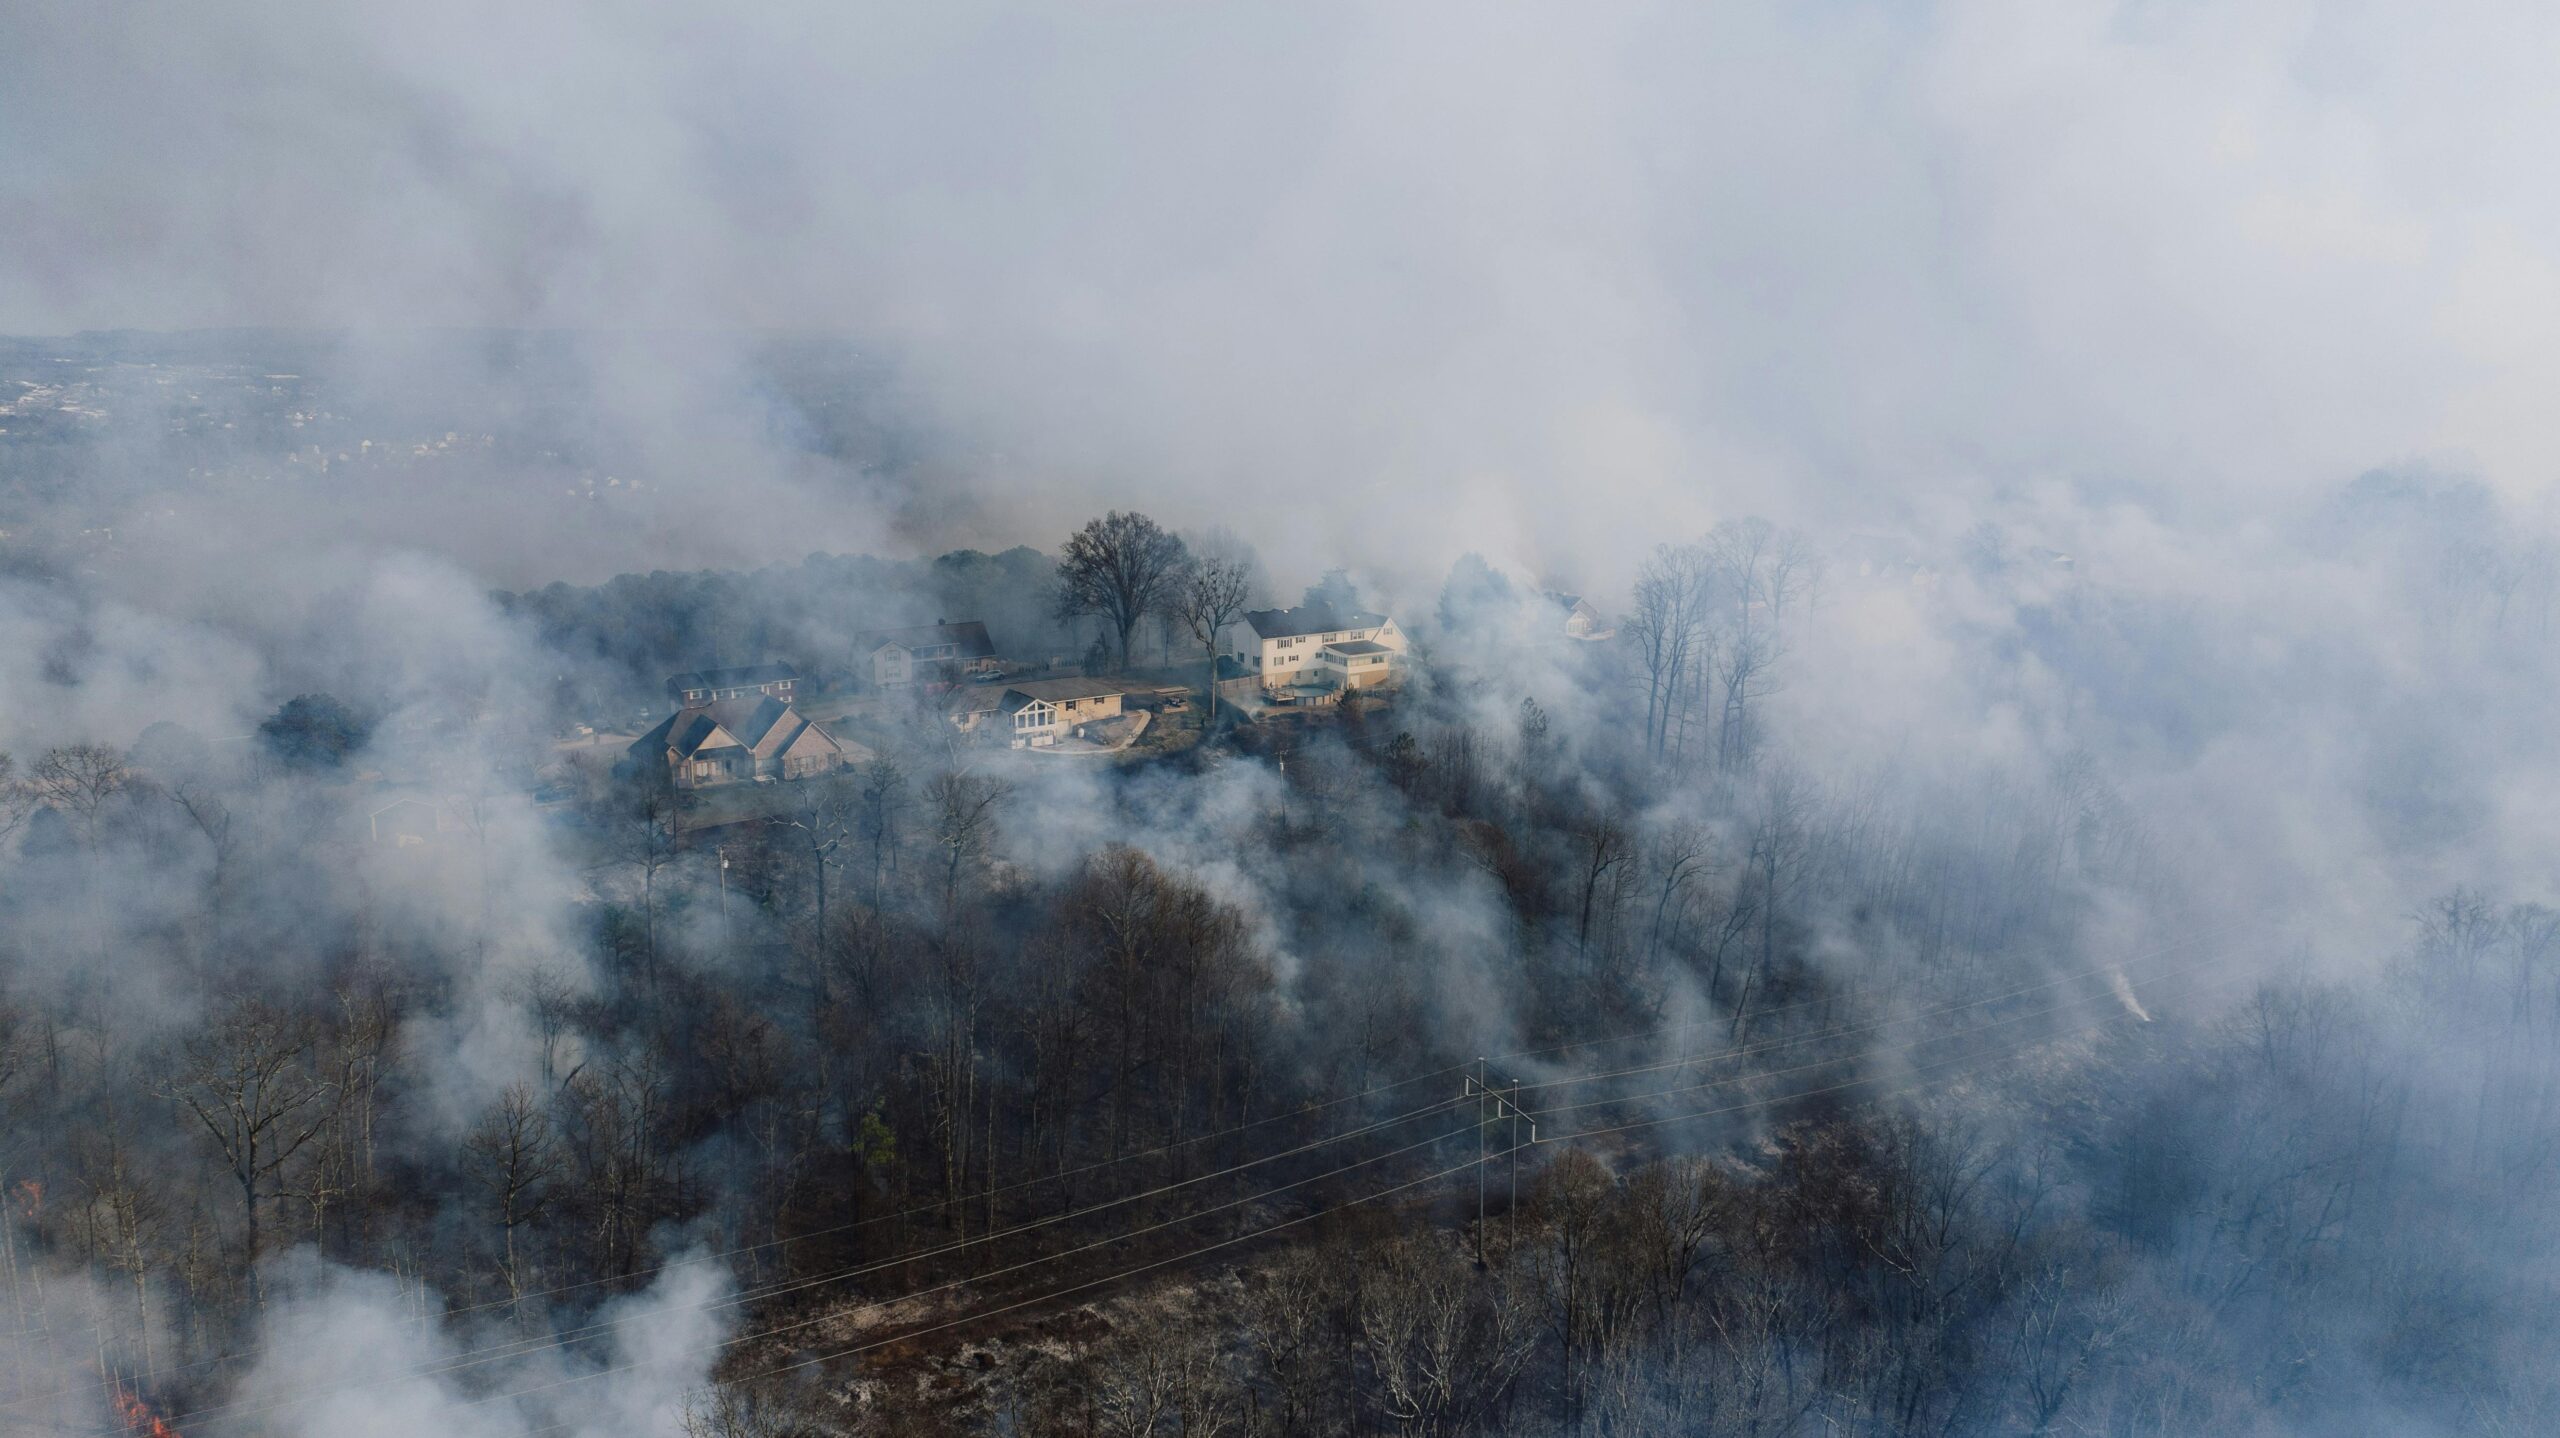
Within the Wildfire Mode, there are many features that assist with current wildfire detection, threat analysis, and policyholder information. Along the left side of the browser, the Current Alerts pane indicates those fires that meet the “Alert” threshold near your policyholders based on a proprietary wildfire score generated by RedZone.
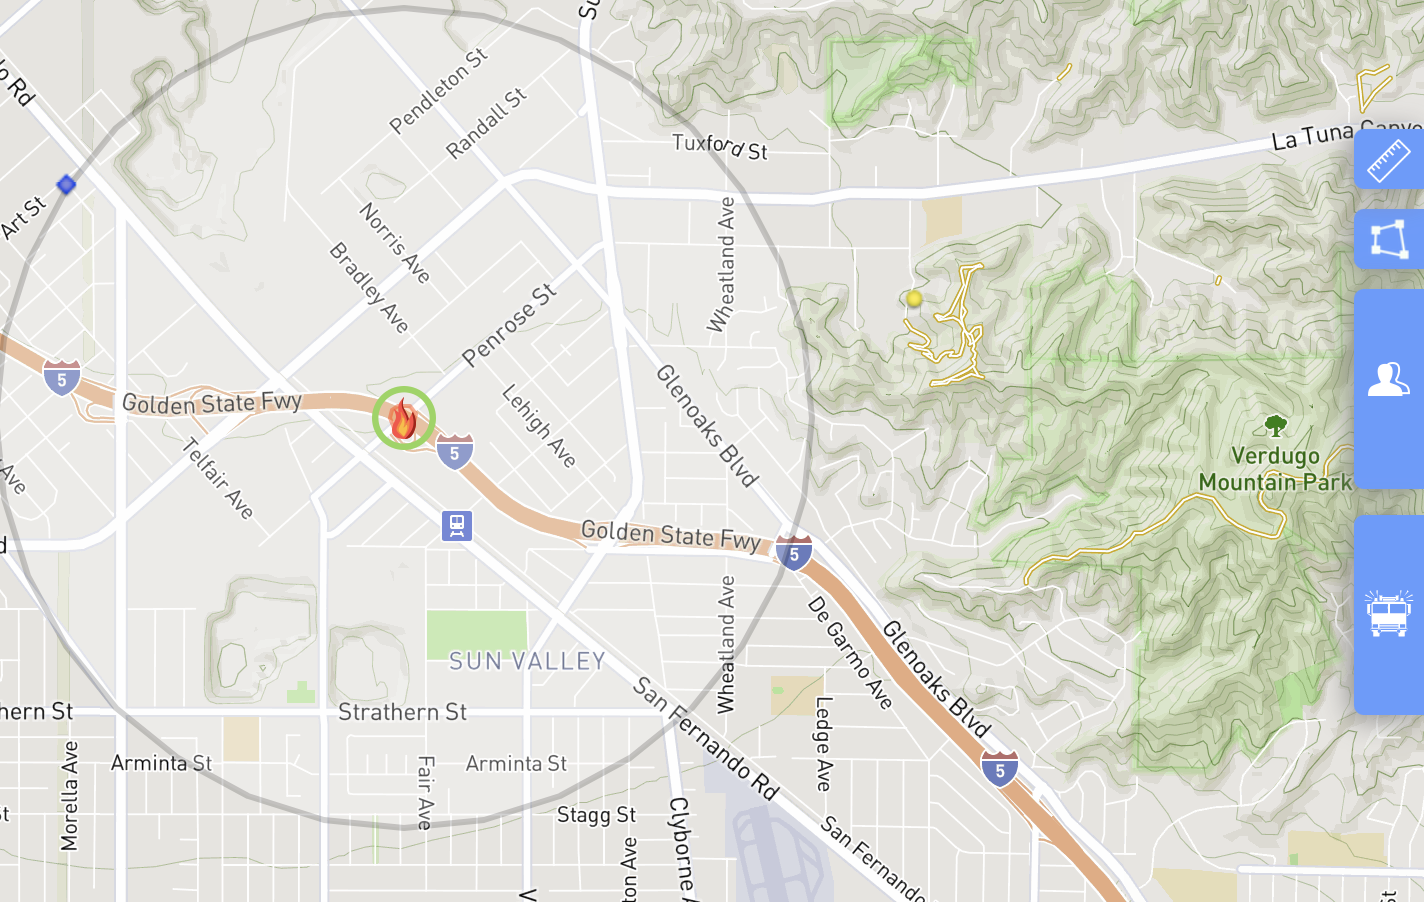
The map in the center allows the user to pan around, zoom in and out to analyze both active and inactive fires in relation to policyholder locations. Along the right side of the browser is where the map tools and map layers exist.
Dashboard Tools
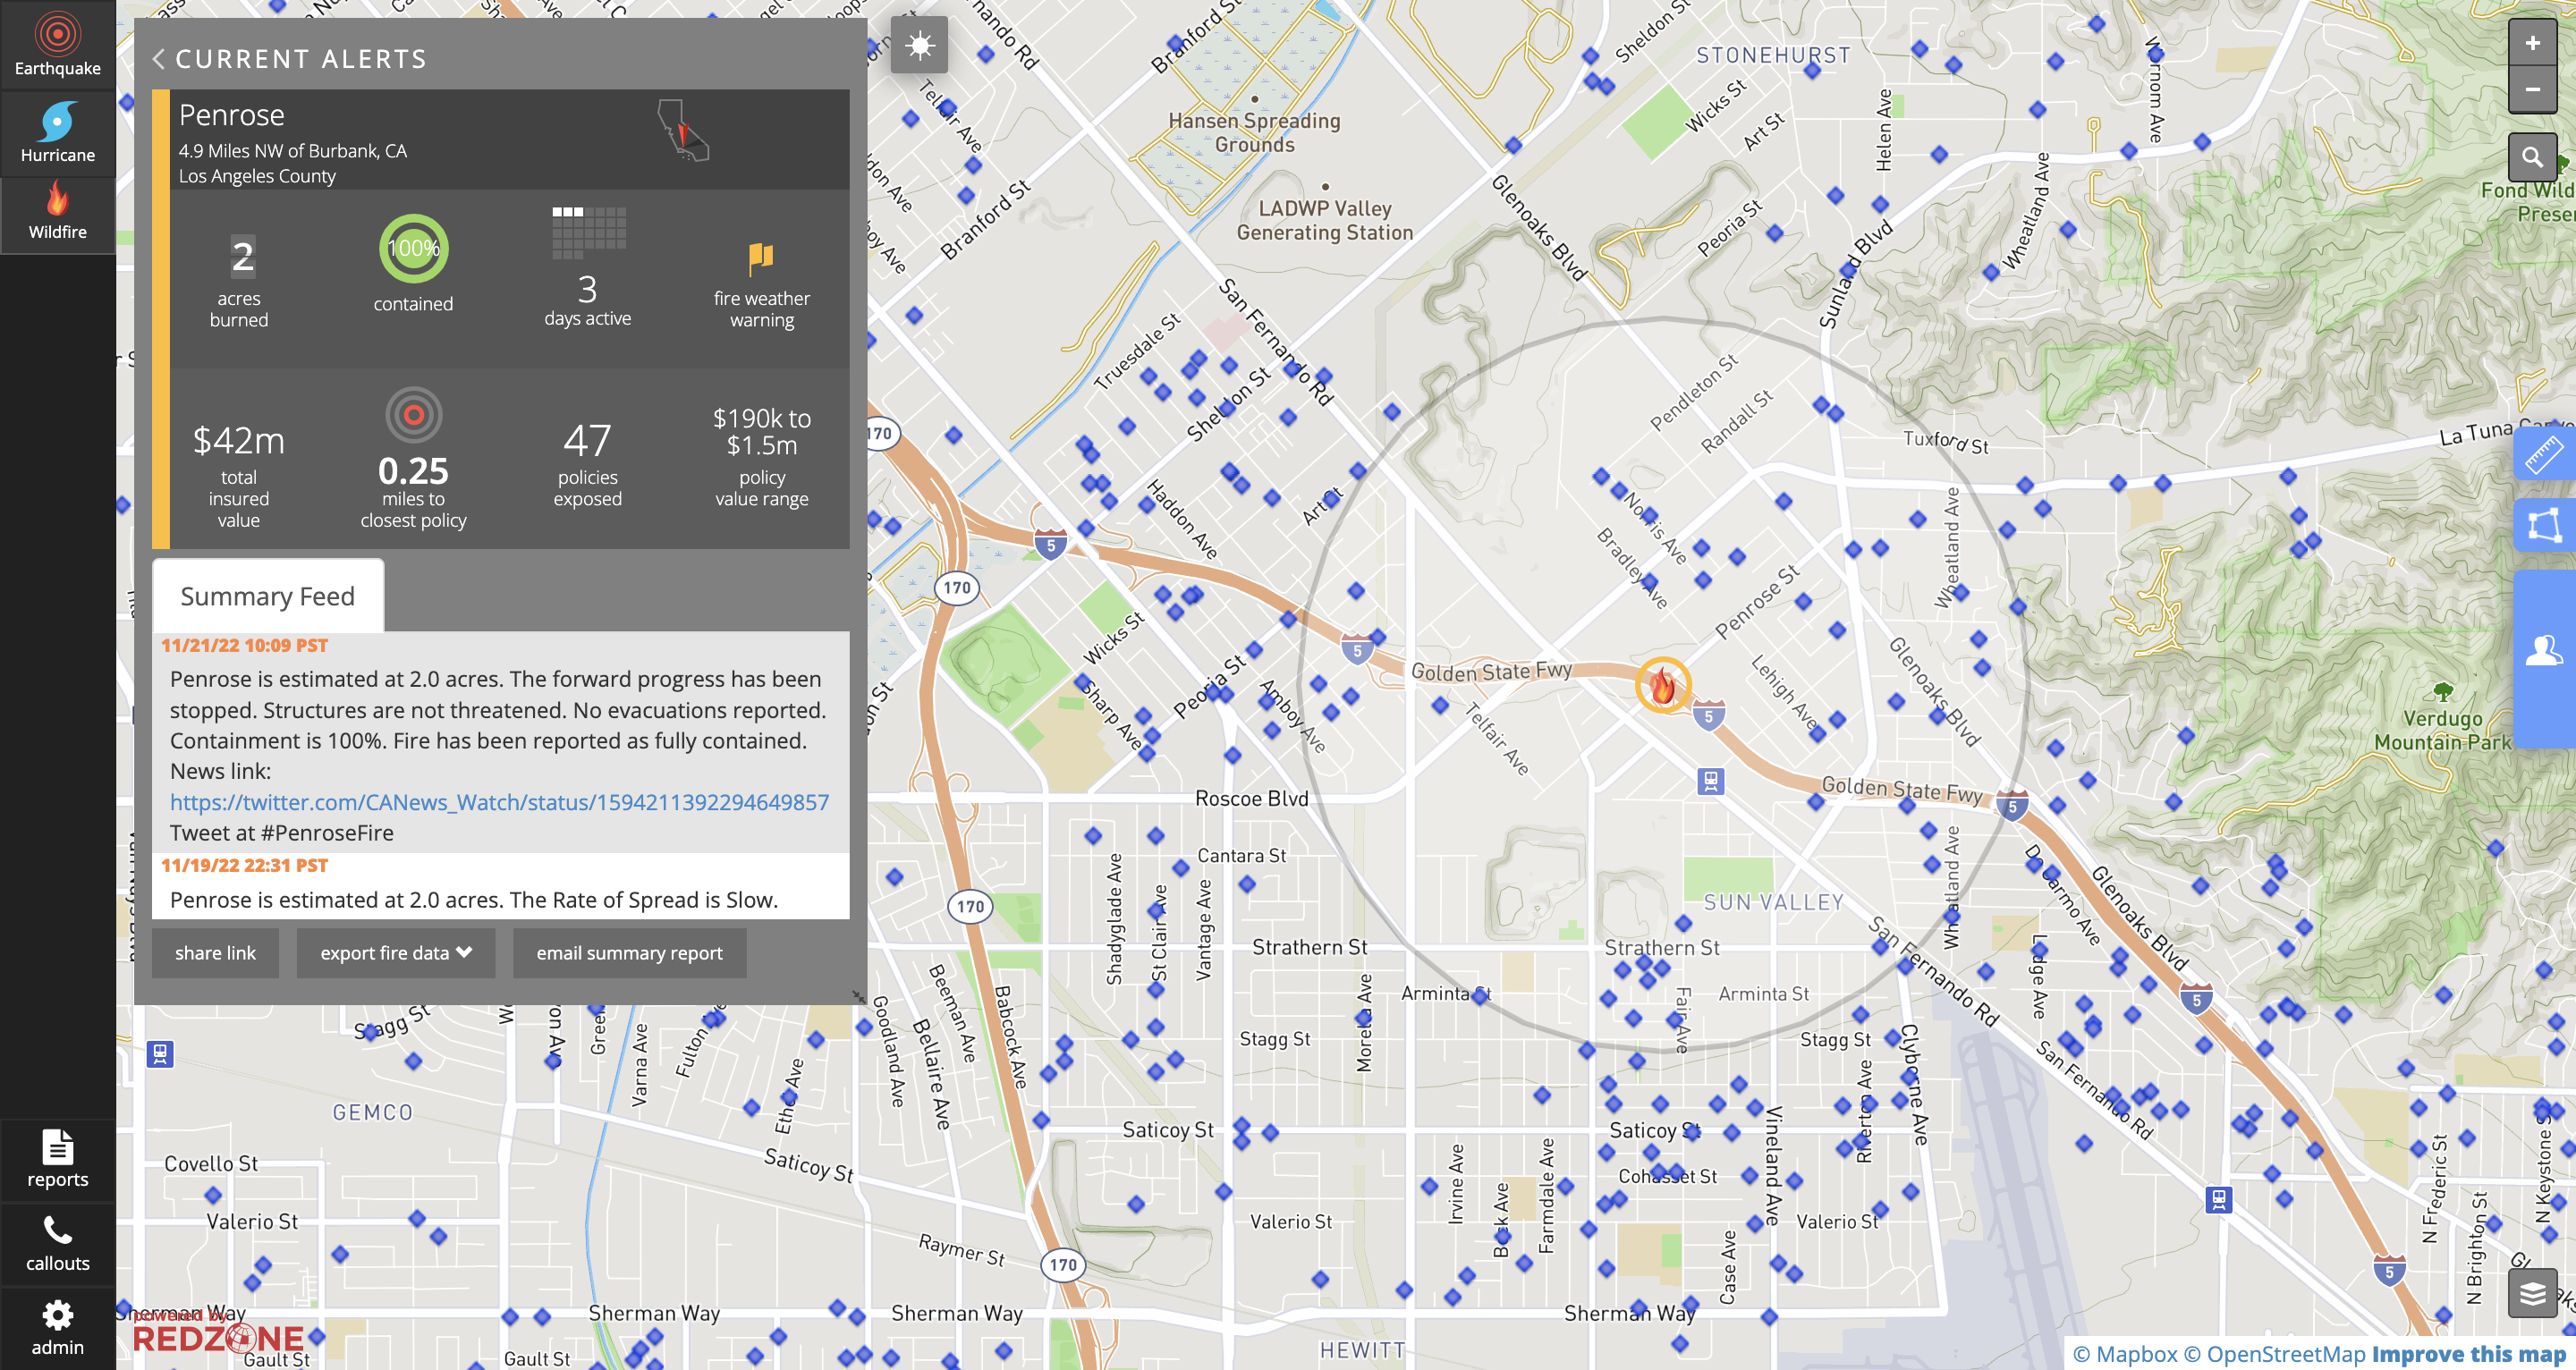
Within Incident details, we have a pane showing both the fire’s summary statistics and the summary feed. The addition of the summary feed will add a timeline of updates such as analyst commentary, containment information, evacuation notices which will vary and be event specific. Additional tools also become available while the Incident Details view is open.
The Policy List tool identifies the list of policyholders within the Exposure Buffer polygon. By default, the list is ordered by closest to farthest from the fire; however, the lists can be sorted by any of the columns displayed. Once in the toolbox, hovering over a name on the list will highlight the home icon on the map. By clicking on an individual client name, you will have access to details on that client’s policy. You will also have the ability to send that client a templated message updating him or her on the ongoing wildfire situation.
This tool allows you to share the link to the incident.
Clicking here will allow you to export fire data in the form of a shapefile.
This tool will generate and email a summary report of the fire.
Navigating the Incident Detail Page
Policy Selection Tool
For some organizations when you are zoomed into an incident the Dispatch Control tool becomes available. This tool allows the user to make field assignments for responders, access response statistics, and download completed response forms.