Overall Comparison
Every year California releases its Damage Inspections (CALDINS) data from wildfires across the state. In 2020, the data surveyed 28,626 impacted structures denoting damage level in 6 categories, ranging from “No Damage” to “Destroyed”. RedZone compared its RZ Risk 3 model to the damage found – and the data did not surprise us!
Redzone’s RZ Risk 3 solution identifies an overall wildfire risk score for a specific structure along with sub-outputs for fire frequency, fire severity, and fire history. The overall risk score ranges from “Minimal Likely” to “Very High.” Additional outputs include historical wildfires close to the structure and the potential cause of loss, such as “Fire” or “Smoke”.

California Damage Inspections 2020 Data vs RedZone Overall Risk Classification
Nearly 96% of the structures confirmed damaged or destroyed in the DINS data for the 2020 fire season fell into RedZone’s Overall Risk Classification of “Very High” and “High”. In correlation with this, the RZ Risk model designated the cause of loss as “Fire”. A very small number of structures (4.13%) which sustained damage fell into “Moderate” or “Low” risk.
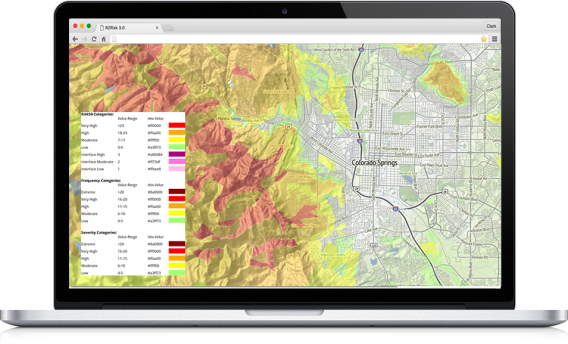
Closer look at RZ Risk Scores in CZU Lightning and North Complex Fire Perimeters
The CZU August Lightning Complex started on August 16, 2020 during a lightning storm that produced over 11,000 lightning strikes. In total, the combination of fires that made up the CZU Lightning Complex burned 86,509 acres across 2 different counties. 1,490 structures were destroyed with another 140 damaged. Evacuations were finally lifted 49 days after the fire started. The CZU Lightning Complex was deemed under control on September 22, 2020, but was not fully extinguished until December 23, 2020 – 3 months and 8 days after the fire started.
Lightning strikes ignited the North Complex on August 17, 2020 and burned a total of 318,930 acres. This complex consisted of the Claremont, Sheep, and Bear fires. The North Complex is California’s 6th largest wildfire. This fire was the 5th deadliest and 5th most destructive wildfire in California history. The North Complex killed 16 people, and damaged/destroyed 2,455 structures. The North Complex was officially 100% contained on December 3, 2020.

CZU Lightning Complex Fire Perimeter With RZ Risk 3 Scores Containing Damaged or Destroyed Structures

North Complex Fire Perimeter With RZ Risk 3 Scores Containing Damaged or Destroyed Structures

Distribution of RZ Risk 3 Scores for Damaged or Destroyed Structures Within the CZU Lightning Complex and the North Complex
When compared to the CAL DINS “Damage” levels, we observe almost no mis-categorizations.

We work hard at RedZone to provide the most accurate risk data models to our clients, and we are proud to see our efforts realized in our model matching the real world outcome. Learn more about our RZ Risk products at the link here.
2 Comments