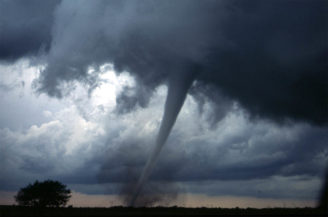
So far this year severe weather has been relatively mild across this United States. Cold air across the central United States has kept the warm moist air at bay, limiting the formation of the violent thunderstorms that can produce a tornado. Since December, NOAA’s Storm Prediction Center has recorded 75% fewer severe weather events, making it the calmest period in 14 years. Thankfully, the few severe storms that have managed to develop haven’t spun off the outbreak of tornadoes that were experienced last year. Comparably, by this time last year over 200 tornadoes had been reported. As we move into the spring and summer months, however, conditions historically become more volatile. Like Hurricanes and Wildfires, Tornadoes have a peak season too.
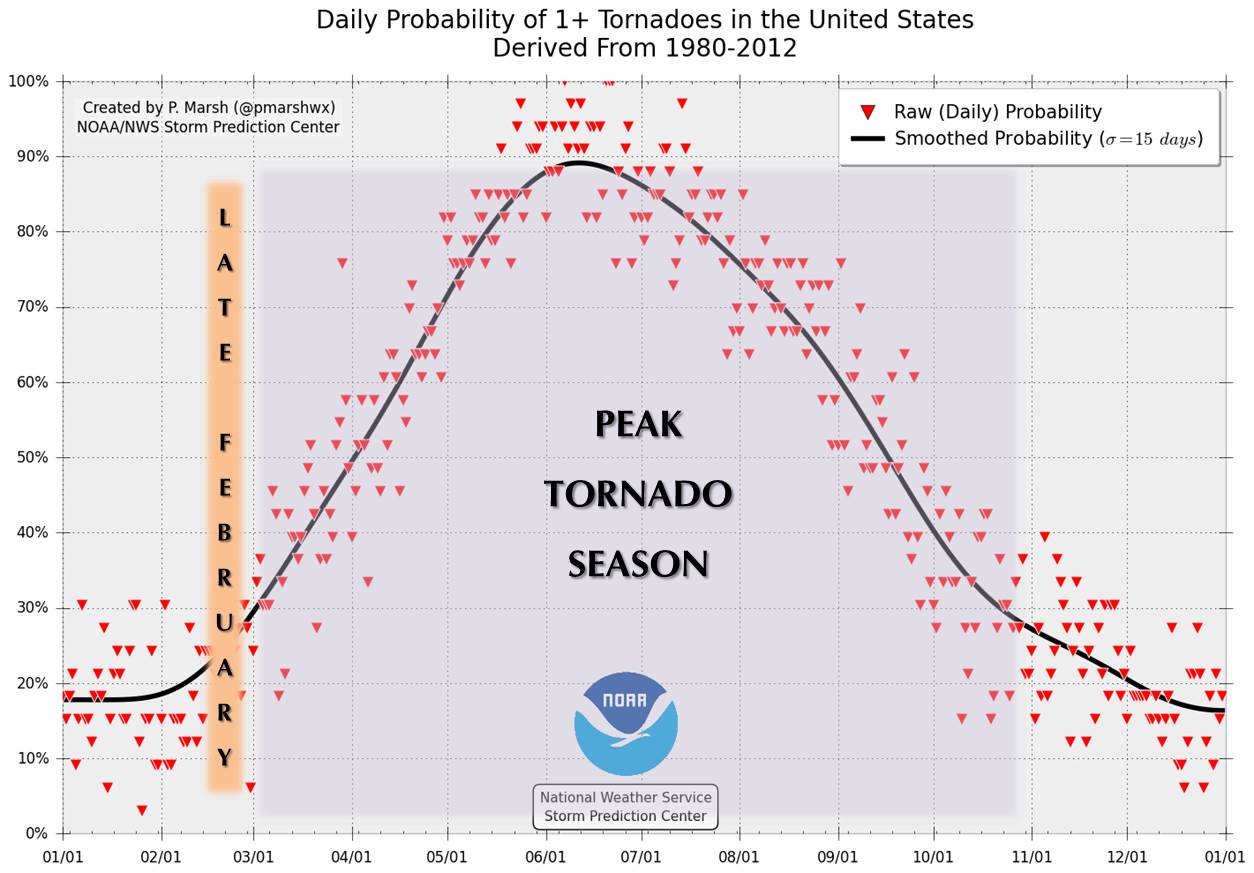
A Timeline depicting the daily probably of a Tornado in the United States (Source: NOAA)
Where is Tornado Alley?
As we move out of winter, warm moist air from the Gulf of Mexico begins to creep up the infamous “tornado alley”. Tornado Alley is the swath of the country’s midsection from Northern Texas to the Canadian border. There are no official boundaries for tornado alley and the term itself is more of a media buzz word rather than scientific distinction. The term, however, isn’t unwarranted. Almost a quarter of all tornadoes occur in this area (depicted in the map below). Although tornadoes can happen across the US, the tornadoes that form in tornado alley are frequently the largest and most destructive.
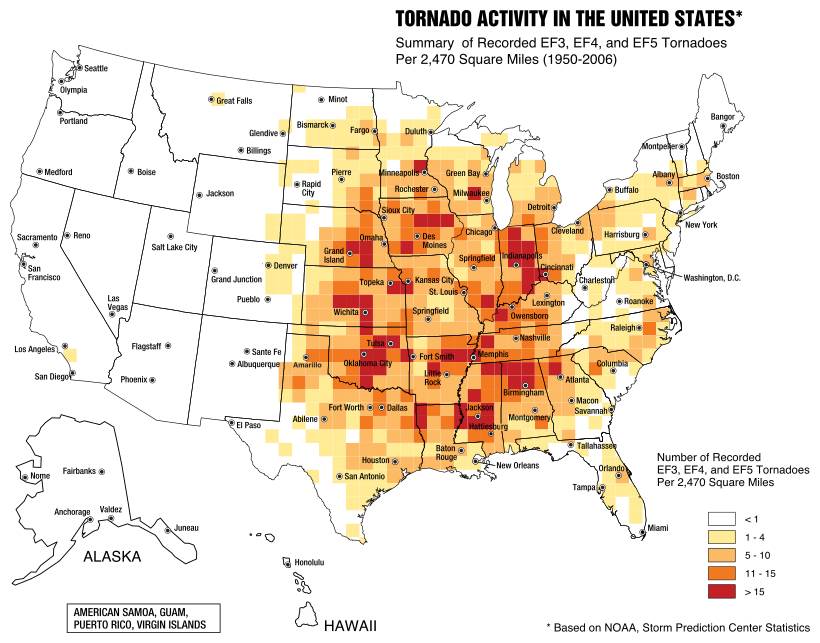
Map showing the where in the United States the most EF3-EF5 tornadoes are recorded. (Image from Federal Emergency Management Agency)
The Enhanced Fujita Scale for Measuring Tornadoes
Like Hurricanes, tornadoes are measured by their wind speeds. Also like hurricanes, they are measured from 0-5, but their categories are based on the Enhanced Fujita Scale. The smallest tornadoes swirl between 65-85 mph which can cause localized damage. On the other end of the scale, the largest tornadoes can tear through counties and cause widespread devastation from their 200+ mph winds. The highest recorded wind speed on earth was measured at 302 mph in 1999 by a mobile weather station during an EF5 event near Oklahoma City, OK. RedZone has found that over the last few years, NOAA has actually developed a way to show tornado paths and destruction. Now anyone can track near-real-time damage from major severe weather events using NOAA’s Damage Viewer.
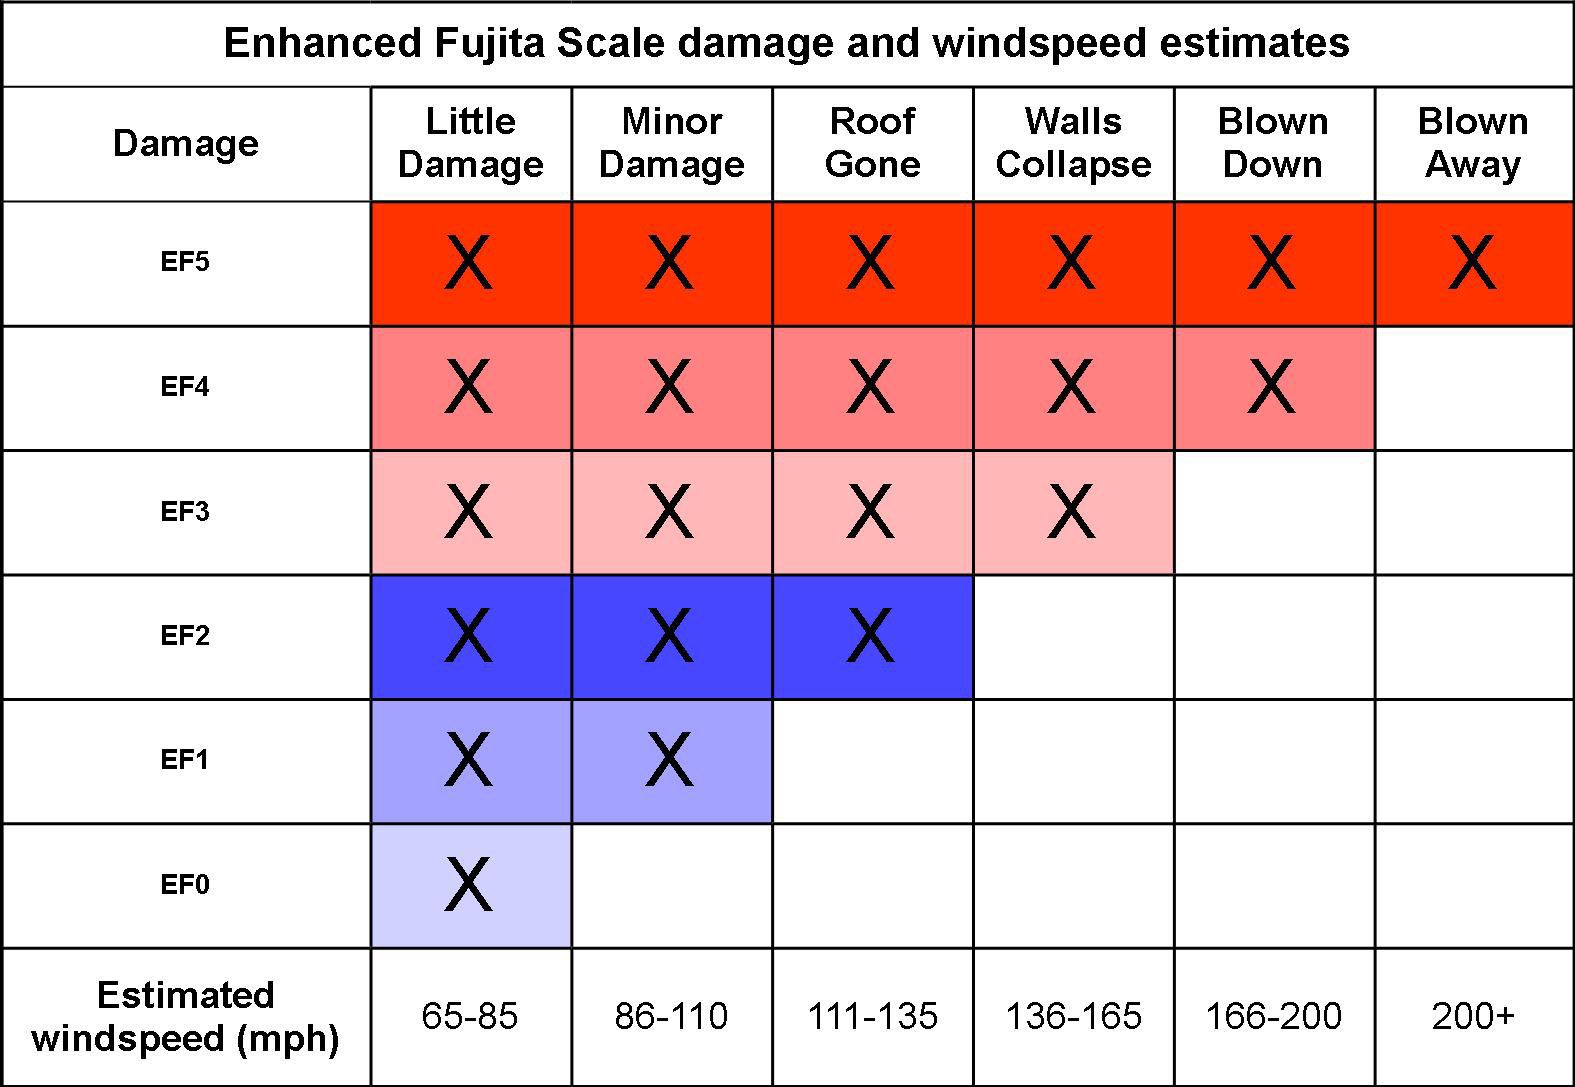
The National Oceanic and Atmospheric Association estimates tornado wind speeds by examining damage to property. The Enhanced Fujita scale ensures that all tornados are rated evenly. Tornados with higher wind speeds and increased damage receive higher EF-values. (U.S. Air Force graphic/Senior Airman Thomas Trower)
SOURCES:
https://www.citylab.com/environment/2015/04/a-monthly-guide-to-peak-tornado-season-in-america/391382/
http://www.koco.com/article/la-nina-outlook-early-and-active-start-to-tornado-season-next-year/13123870
https://www.ready.gov/tornadoes
https://en.wikipedia.org/wiki/Tornado_Alley
3 Comments